FP&A teams are expected to do much more than report financial performance. They need to explain why performance changed, assess what is likely to happen next, and help management make better decisions.

Why did revenue miss the forecast? Which products or business units are driving margin changes? Where are costs moving away from plan? How reliable is the latest forecast? What does current performance indicate for the rest of the year?
The difficulty is that the information required to answer these questions often sit across multiple systems.
Actuals may reside in the Enterprise Resource Planning (ERP) systems such as SAP, budgets and forecasts in planning applications or spreadsheets, sales data in Customer Relationship Management (CRM) systems, and workforce information in HR platforms. Management reporting may rely on additional extracts and calculations maintained by individual teams. The result can be multiple versions of the same financial metric and significant effort spent reconciling them.
For FP&A, creating a single source of truth is therefore not just a data initiative. It is the foundation for faster, more reliable financial analysis and decision-making.
Why Multiple Versions of the Truth Emerge
Finance environments naturally become more complex as organizations grow. New products, geographies, business units and acquisitions introduce additional systems and reporting requirements. Planning processes may evolve separately from accounting processes. Individual functions create reports to meet their own needs. Also, the consumption of the data and its usage depend on the job role.
Revenue in an executive dashboard may differ from an FP&A report. Product hierarchies used by sales may not match those used by finance. Actuals may follow one organizational structure while forecasts use another. Different teams may apply different allocation methodologies when calculating profitability.
Over time, even basic metrics can become difficult to reconcile. FP&A then spends a disproportionate amount of time collecting, validating and reconciling information before meaningful analysis can begin.
The impact is significant: reporting cycles become slower, confidence in management information declines, and finance capacity gets diverted from analysis toward data preparation.
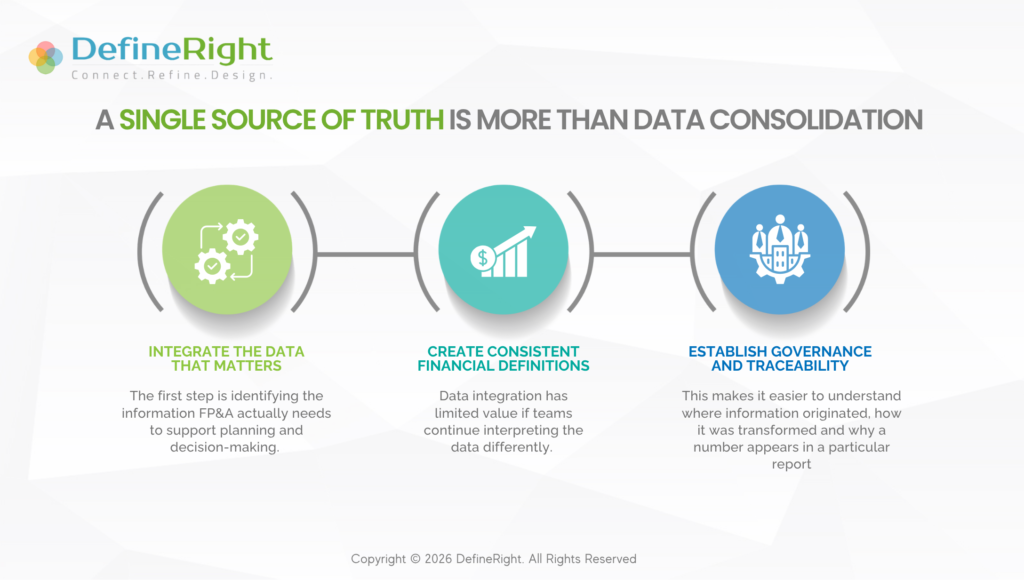
A Single Source of Truth Is More Than Data Consolidation
A common response to fragmented reporting is to consolidate information into a data warehouse or cloud data platform. Putting information from multiple systems into one platform does not automatically resolve differences in definitions, hierarchies, calculations or ownership.
A robust FP&A analytics foundation requires four elements working together: integrated data, standardized definitions, governance and consistent reporting.
1. Integrate the Data That Matters
The first step is identifying the information FP&A actually needs to support planning and decision-making. This may include general ledger actuals, budgets and forecasts, sales and revenue information, product and customer data, headcount, expenses, pricing and business-unit performance.
The objective should not be to bring every available dataset into a central platform. It should be to determine which business questions FP&A needs to answer and then identify the data required to answer them. This creates a business-led rather than technology-led data foundation.
It also establishes connections between financial and operational information. A revenue variance, for example, becomes more useful when FP&A can connect the financial result with underlying changes in volumes, pricing, customers or products.
2. Create Consistent Financial Definitions
Data integration has limited value if teams continue interpreting the data differently. Core metrics therefore need standardized definitions and calculation rules.
What constitutes revenue for management reporting? How is gross margin calculated? Which costs are allocated to individual products or business units? What exchange rates are used? How are actuals mapped against forecast categories?
The same principle applies to dimensions and hierarchies. Products, customers, geographies, cost centers and business units need consistent structures if performance is to be compared across different reports. These definitions should not remain embedded inside individual spreadsheets or dashboard formulas. Creating standardized KPIs, dimensions, hierarchies and business rules establishes a common financial language across the organization.
3. Establish Governance and Traceability
A single source of truth also needs clear ownership. For important financial metrics, FP&A should ideally be able to trace:
Source system → transformation/business rule → financial metric → management report
This makes it easier to understand where information originated, how it was transformed and why a number appears in a particular report. Governance should define ownership for critical datasets, financial definitions, hierarchies and reporting logic.
This becomes especially important when the business changes. A new product, organizational restructuring or system migration can affect multiple downstream reports. Without governance, teams may update these independently, creating another round of inconsistencies. With defined ownership and change processes, the analytics environment can evolve without continuously creating new versions of the truth.
Build Analytics on the Common Foundation
Once the underlying foundation is established, FP&A can build reusable analytics capabilities instead of creating isolated reports.
Executive reporting can provide consistent views of revenue, margin, expenses and other KPIs across products and business units. Budget-versus-actual analytics can systematically identify variances. Forecast-versus-actual reporting can highlight where assumptions need adjustment.
The same foundation can support profitability analysis across products, customers or geographies, as well as trend and driver analysis that explains why financial performance changed.
The important distinction is that the organization is no longer creating a separate data process for every dashboard. Multiple analytical use cases are drawing from the same governed information foundation.
Automation Can Shift FP&A from Reporting to Analysis
Many finance teams still spend substantial time extracting data, updating spreadsheets, checking formulas, reconciling numbers and assembling management reports.
A common analytics foundation creates an opportunity to automate much of this process. The immediate benefit is faster reporting. The more important benefit is what FP&A can do with the capacity released.
Instead of asking whether two reports reconcile, analysts can investigate questions such as:
What is driving the variance? Is the change temporary or structural? Which products are affecting profitability? Where is forecast accuracy deteriorating? Which assumptions should management reconsider?
This shifts FP&A from report production toward decision support.
Do Not Start with the Dashboard
One of the most common mistakes in finance analytics is beginning with visualization. Management asks for a dashboard, requirements are gathered around charts and layouts, and development starts.
But if the underlying data and definitions remain inconsistent, the organization simply creates a more visually sophisticated representation of the same reporting problems.
A stronger sequence is: Business questions → KPI definitions → source data → data model → governance → reporting and visualization
If management wants better visibility into product profitability, for example, the first decision is not which BI tool to use. Finance first needs to define profitability, determine which costs should be allocated, establish the relevant product hierarchy and identify the source of each input. The dashboard should be the final delivery layer: not the starting point.
Building the Foundation for Better Decisions
A single source of truth does not require every finance activity to operate within one system.It requires a governed analytical foundation through which information from ERP, planning, commercial and other enterprise systems can be consistently interpreted.
When that foundation exists, management receives more consistent information, variances can be investigated faster, forecasts can be evaluated systematically, and profitability can be analyzed across common dimensions. Most importantly, FP&A can spend less time assembling the numbers and more time explaining what they mean.
The objective of finance analytics is ultimately not to produce more dashboards or reports. It is to create one trusted financial view of the business and turn that view into better decisions